B2B concept test sample size: how many do you need?
B2B concept tests rarely get consumer-sized budgets. What sample size you actually need, what each cell size lets you conclude, and how to design around a small, expensive audience.
 By Jennifer Ray, founder of Valid N ResearchPublished
Key points
- Start with the decision the test has to support. Picking a winner, passing a benchmark, and diagnosing a concept each need a different sample.
- A single score from 100 respondents has a margin of error of about 10 points for a score near 50%, so the true figure could plausibly be 10 points higher or lower. Comparing two concepts needs a much larger sample, because the uncertainty applies to both.
- With 150 respondents per cell, only differences of around 16 points or more are reliably detectable. Many real differences between concepts are smaller than that.
- Sequential monadic designs, where each respondent sees several concepts, get more out of a small audience, at the cost of order effects.
- Every subgroup you want to read needs its own base. Plan the cells before you plan the total.
- At small sample sizes, each bad respondent matters more, so screening matters more too.
In B2B, each complete can cost many times what a consumer complete does, so "what sample size do we need?" turns into "how few can we get away with?" That's a fair question, as long as everyone knows what a smaller sample can and can't tell them.
This guide shows what different cell sizes actually let you conclude, why the number that matters is usually the difference between concepts rather than each score on its own, and how to design a concept test around a small, expensive audience.
Start with the decision, not the number
The right sample size depends on what the test has to decide:
- Choosing between finalists. Two or three concepts, and the business will build one. The test has to detect a difference between them, which is the most demanding case.
- Go or no-go against a benchmark. One concept, compared with a norm or an earlier winner. The test has to place one score precisely enough to say which side of the line it falls on.
- Screening early ideas. Four to six rough concepts, reduced to the best two or three. Precision matters less than spotting clear winners and losers.
- Diagnosing a concept. Why it works or doesn't, what's unclear, what to change; this is mostly open ends and follow up questions, and it often suits a qualitative round better than a large survey.
Write down which one you're doing before anyone discusses numbers. Most arguments about sample size are really arguments about which of these the test is for.
What a cell size buys you
The margin of error for a single percentage, such as the share of respondents who say they'd definitely or probably buy, depends on the sample size. At 95% confidence, for a score around 50%:
| Respondents in the cell | Margin of error |
|---|---|
| 50 | about ±14 points |
| 100 | about ±10 points |
| 150 | about ±8 points |
| 200 | about ±7 points |
| 300 | about ±6 points |
| 400 | about ±5 points |
So a top-two-box score of 40% from 100 respondents means the true figure is plausibly anywhere from about 30% to 50%. That's often enough to tell a strong concept from a weak one. It isn't enough to distinguish two decent concepts. The margin of error calculator works these out for any sample size and score.
Comparing two concepts: the difference is what matters
When you compare two concepts tested on separate groups of respondents, the uncertainty applies to both scores, so the difference between them is less certain than either score on its own.
A practical way to think about it is the smallest difference the test can reliably detect. At the conventional standards of 95% confidence and 80% power, for scores around 50%:
| Respondents per cell | Smallest difference reliably detected |
|---|---|
| 100 | about 20 points |
| 150 | about 16 points |
| 200 | about 14 points |
| 300 | about 11 points |
| 400 | about 10 points |
These figures assume separate, independent groups of respondents and scores near 50%, where uncertainty is greatest. Scores further from 50%, such as 20% or 80%, need somewhat smaller differences to be detected.
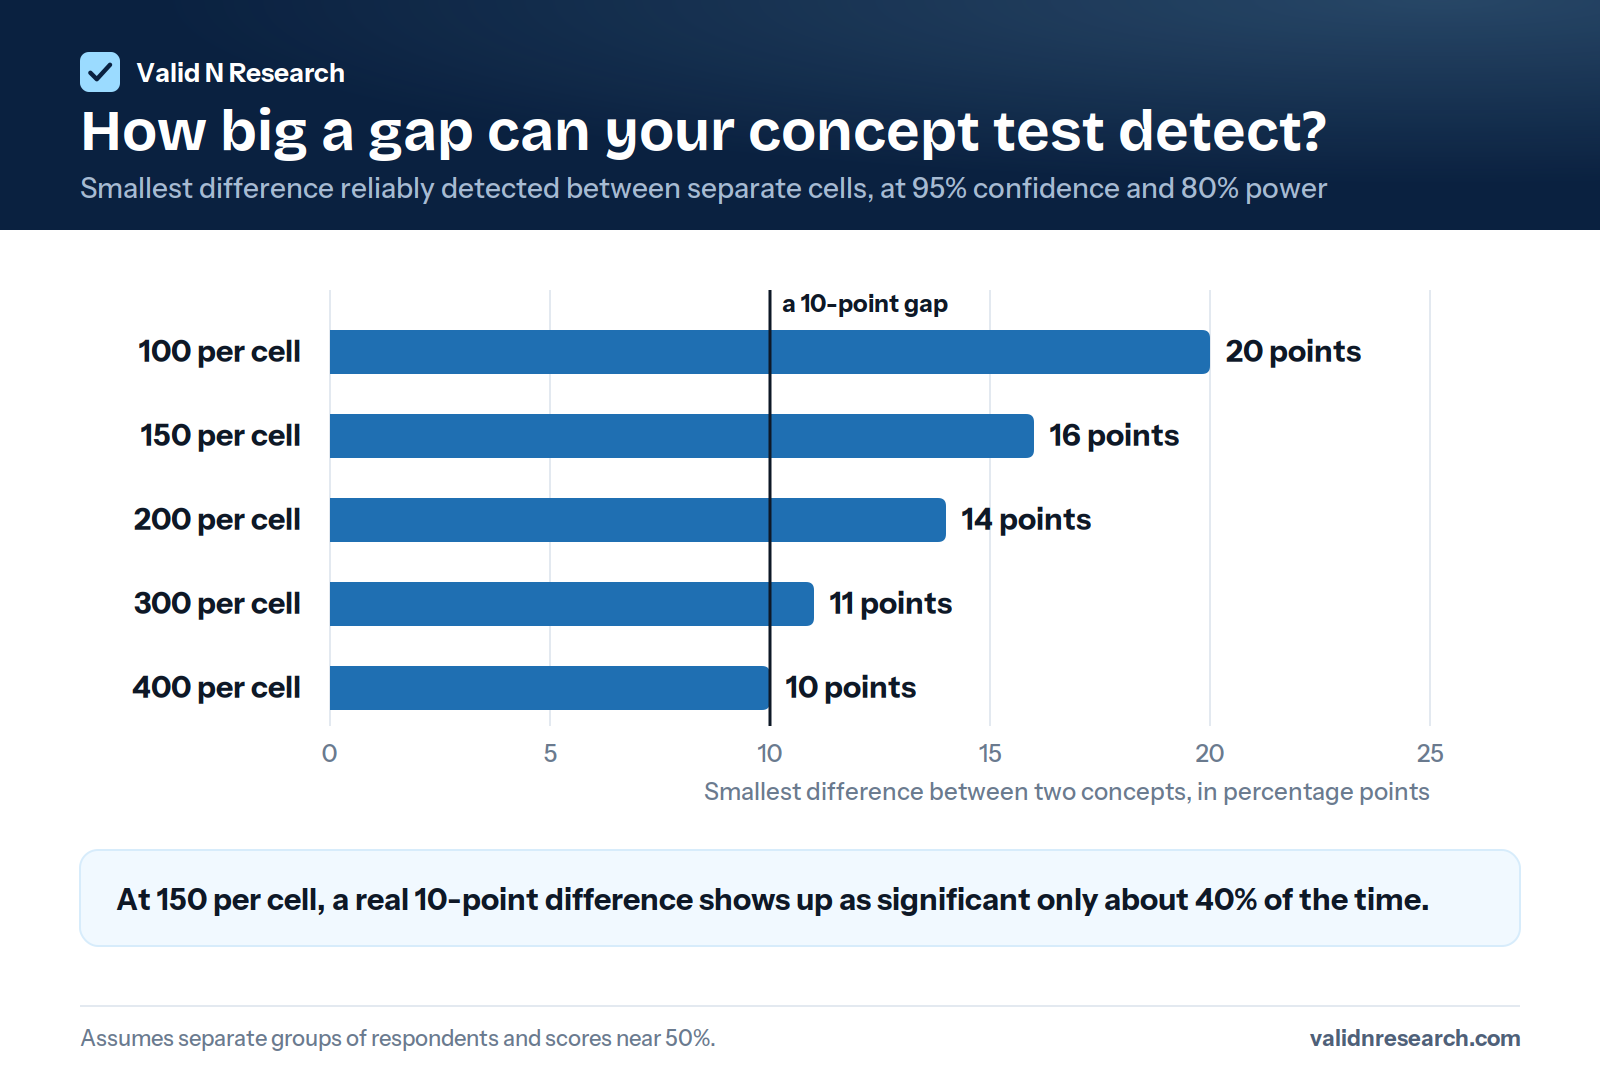
This table matters most, and it's sobering. With 150 respondents per concept, a real 10-point gap between two concepts will fail to show up as significant more often than not. The chance of detecting it is only about 40%. And finalists are usually close, which is why they're finalists.
That leaves three honest options: test with larger cells, use a design that gets more comparisons out of each respondent, or agree in advance that smaller differences will be treated as directional rather than proven.
With three or more concepts, a second trap appears. Every pair you test is another chance for a difference to appear significant by luck, so the more pairs you compare, the more likely one looks like a winner when it isn't. Formal statistical adjustments for this exist, but many commercial concept tests handle it more simply: decide in advance which comparison the decision rests on, and treat the others as supporting evidence.
Monadic or sequential monadic?
In a monadic design, each respondent sees one concept. Each score is uncontaminated by the others, making it the cleanest comparison and the right choice for benchmarking against norms. It's also the most expensive, because each concept needs its own full cell.
In a sequential monadic design, each respondent sees several concepts one after another, in rotated order. When everyone sees every concept, every respondent counts toward every concept's score. Because the same people rate each one, comparisons are usually more precise than with the same number of respondents split into separate cells.
The cost is order effects. Respondents rate the concept they see first differently from the one they see third, and later concepts get rated against earlier ones. Two habits keep that under control:
- Rotate the order so each concept appears in each position equally often.
- Read the first-position ratings separately. Those are effectively a monadic read, and if they tell a different story from the full data, treat them as the cleaner read. When everyone sees every concept in a balanced rotation, each concept's first-position base is roughly the total divided by the number of concepts, so with a small total, use it to check direction.
For small, expensive B2B audiences, sequential monadic is often the practical choice for screening and choosing between concepts. Keep it to as many concepts as respondents can evaluate carefully, usually three or four, and keep each concept short. If you're screening more than that, show each respondent a rotated subset. Allow for mobile, too. Many B2B respondents take surveys on a phone between meetings, and several dense, text-heavy concepts in a row on a small screen invite skimming and drop off. Check how the concepts look on a phone, and watch completion times in the soft launch. Use monadic cells when a score has to stand on its own against a benchmark.
Plan the cells before the total
Every group you want to report separately needs its own base. If the test must also show results by company size, role, or region, each of those groups needs enough respondents to read in every cell.
This is where B2B concept tests usually grow. A monadic test of three concepts with 150 per cell is 450 completes. Add a requirement to read enterprise and mid market separately, at 100 each per cell (200 per cell overall), and it becomes 600, with the enterprise cells often the hardest and most expensive to fill.
Many researchers treat groups under about 50 as too small to report, and anything under 100 as directional. Decide which comparisons actually need to be read, and which can be reported for the total only.
What does low incidence do to the budget?
In B2B, how hard each complete is to find matters as much as how many you need. At 10% incidence, 300 completes take about 3,000 screener starts, before any drop off or quality removals. At 5%, they take about 6,000. The cost per complete estimator shows how cost moves with incidence.
When the audience is narrow and the budget is fixed, the choices usually are:
- Fewer concepts. Screen early ideas cheaply first, then properly test only the finalists.
- Sequential monadic instead of separate cells.
- Fewer subgroups, with some comparisons reported for the total only.
- A broader but still relevant audience for the early rounds, saving the narrow audience for the final choice.
- A qualitative round first, to fix unclear concepts before paying to measure them.
Starting points by objective
These are starting points built on the precision tables above, not rules. Adjust them for the size of the difference that would change the decision.
| Objective | Design | Starting sample |
|---|---|---|
| Screen four to six early concepts | Sequential monadic, each respondent sees three or four, rotated | Enough respondents for about 100 ratings per concept, which gives each score a margin of error of about ±10 points |
| Choose between two or three finalists | Sequential monadic, or monadic if order effects are a worry | 200 to 300 in total sequential, with everyone rating every concept in rotated order, or 300 or more per cell monadic |
| Go or no-go against a benchmark | Monadic | 150 to 200 per cell, if the benchmark was measured the same way on a solid base of its own |
| Understand why a concept works | Survey with strong open ends, or qualitative interviews | Smaller samples, chosen for depth rather than precision |
The sequential monadic totals are lower than the monadic ones because every respondent rates every concept. Each comparison is made within the same people, which usually makes it more precise than separate cells with the same total number of respondents.
Quality matters more when the sample is small
At 100 respondents, each person is 1% of the result. A handful of people who don't hold the role they claim, or who clicked through without reading the concept, can move a score by several points, which is the same size as the differences the test is trying to find.
So the screener deserves as much attention as the sample size. Our guide to IT decision maker screener questions shows how to qualify people on their actual role, and our fraud prevention guide covers the checks that keep bad completes out.
How we help
Send us the concept test design, including the cells and any subgroups you need to read, and we'll come back with feasibility for each cell, not just the total. The sample size calculator is a good place to start the conversation, and when you're ready, send us the brief.
Related guides
IT decision maker screener questions
A complete example screener with wording, terminate logic, and the knowledge checks that catch fakes.
Read the guideB2B cost per complete benchmarks
Market CPI ranges by incidence band, typical incidence by audience, and the method behind the numbers.
Read the guideB2B sample buyer's guide
How to brief a sample vendor, what to ask at feasibility, and the contract clauses that protect your data.
Read the guideB2B concept test sample size: frequently asked questions
How many respondents do I need per concept?
Start from the smallest difference between concepts that would change the decision. With separate cells, about 150 respondents per concept detects differences of around 16 points, 300 detects around 11, and 400 detects around 10. Sequential monadic designs need fewer respondents in total for the same comparison.
What is the margin of error for 100 respondents?
About plus or minus 10 points at 95% confidence, for a result around 50%. So a score of 40% from 100 respondents could plausibly be anywhere from about 30% to 50%.
How do I work out the sample size for a concept test?
Decide what the test has to decide, then the smallest difference or margin of error that matters for that decision. Use that to set the base per cell, multiply by the number of cells and any subgroups you need to read separately, and then check feasibility and cost at your audience's incidence.
What is the minimum sample size for a B2B concept test?
There isn't a single minimum. It depends on what the test has to decide. For choosing between concepts, cells of 100 only detect differences of about 20 points reliably, so many teams use sequential monadic designs to get more out of each respondent.
Is 100 respondents per concept enough?
It's often enough to tell a strong concept from a weak one, with a margin of error of about 10 points on each score. It isn't enough to reliably separate two close concepts, and it leaves little room to read subgroups.
Should I use monadic or sequential monadic?
Use monadic when each score has to stand alone, such as against a benchmark, and the budget allows a full cell per concept. Use sequential monadic when the audience is small and expensive and the main goal is comparing concepts, and rotate the order.
How many concepts can one respondent evaluate?
Usually three or four, if each concept is short. Beyond that, attention drops, and later concepts are judged more against earlier ones than on their own merits.
Does weighting change the sample size I need?
It can. Weighting reduces the effective sample size, so a cell of 200 that needs heavy weighting behaves more like a smaller one. If you expect to weight, plan for a slightly larger sample or tighter quotas.
Send the spec. Get real numbers back.
Audience, market, target n, expected interview length. Feasibility the same business day for standard audiences, with reachable counts, an estimated qualification rate we believe and a quoted cost per complete that stays fixed for the agreed brief.