B2B survey incidence lower than quoted? What to do
Incidence on your B2B survey is running well below the quote. How to check the math, find the cause, choose a fix, and stop it happening on the next study.
 By Jennifer Ray, founder of Valid N ResearchPublished
Field status, day 2
1,000 screener starts, 70 qualified
Where people are leaving
- S4 Organization size35% out
- S9 Purchase role50% out
Check the math first, then find the question behind the gap. This guide walks through the same example.
Key points
- Start with the math. Quota closures, drop offs, and quality removals are often counted as screen outs, which makes incidence look lower than it is.
- Find which screener question is terminating people. One question usually explains most of the gap.
- Try the live survey yourself. Wording and programming errors are common, and they're the easiest mistakes to correct.
- Compare the screener with the brief the quote was based on. Requirements added after quoting are a frequent cause of a gap.
- Choose the least disruptive fix: correct errors, then extend field, add sources, or change the spec, in roughly that order.
- Before the next study, send the actual screener with the feasibility request and agree what happens to the price if incidence comes in low.
Field opened two days ago, and far fewer people are qualifying than the quote assumed. The supplier is asking for a requote or a longer field window. The deadline hasn't moved, and nobody is sure yet whether the problem is the audience, the screener, or the math.
Low incidence is a common reason B2B studies run late and over budget. It's also one of the most fixable, if you find the cause early. Here's how to check whether incidence really is low, how to find out why, what your options are, and who should pay for what.
What incidence measures, and what it doesn't
Incidence rate is the share of screener starts that qualify. If 1,000 people start the screener and 150 qualify, incidence is 15% (150 ÷ 1,000). Some suppliers define the denominator differently, which is one more reason to agree the incidence definition in writing before field.
Don't mix it up with:
- The completion rate. People who qualify and then abandon the main survey are drop offs, not screen outs.
- Quota closures. Someone who qualifies but lands in a full quota cell is over quota. They count as qualified for incidence, even though you can't use them.
- Quality removals. A complete removed for speeding or a bad open end qualified first and was removed later. Removals are reported separately.
- People who leave partway through the screener. They aren't screen outs either. Under a starts-based definition like the one above, they stay in the denominator, so a long or confusing screener that loses people partway can look like an incidence problem. Some suppliers take them out of the denominator, so ask which one yours uses.
Mixing these up is a common reason incidence looks worse than it is. If a field report counts over quota respondents and drop offs as screen outs, a healthy study can look like it's in trouble. So before anything else, ask for the raw counts: screener starts, screen outs by question, over quota, drop offs, completes, and removals. Then calculate it yourself, or use the incidence rate calculator.
Why incidence comes in below the estimate
Once the math is right, the gap usually comes from one of these:
- The screener is stricter than the brief the quote was based on. The quote was for "IT decision makers at companies with 100+ employees." The screener that went live requires final decision makers for cloud security at companies with 1,000+ employees. Each added requirement cuts incidence, and several together can cut it dramatically.
- One question terminates far more people than expected. A company size floor that's higher than intended, a "don't know" set to terminate, or a purchase role question that only accepts the first option.
- A programming error. A terminate attached to the wrong answer, broken skip logic, or a quota that closed at zero. These are more common than anyone likes to admit, and they cost almost nothing to fix once you find them.
- Interlocking quotas. Overall incidence can be on target while one cell, such as enterprise CISOs in healthcare, barely moves. The study stalls on its rarest combination, which feels like low incidence even though the overall rate is fine.
- Stricter screening than the estimate assumed. If more people are failing a knowledge question in the screener than expected, it may be doing its job and keeping out people who shouldn't qualify. If almost everyone fails it, check the answer key first.
- The estimate was optimistic. Some estimates are built on broader definitions or broader supply than the study actually uses.
- Loose targeting or stale profiles. If invitations go to a broader audience than the study needs, or profile data is out of date, more people start the screener who were never likely to qualify. A quote built on panel profiles assumes those profiles are right, and the screener finds out whether they are. Ask the supplier how they targeted invitations.
- Timing. Holidays, the end of a quarter for finance roles, or a major industry event mostly slow response. They lower incidence only when they change who responds, for example when junior staff answer while senior people are at a conference.
How to find the cause
Many gaps can be traced in an hour with the right data.
1. Get a screener funnel
Ask for the number of respondents who reached and failed each screener question. Laid out in order, it shows where people are leaving. Here is an illustrative example for an IT decision maker screener, with incidence quoted at 15% and running at 7%. To keep the arithmetic simple, nobody leaves partway through:
| Screener question | Reached | Terminated here | Terminated as a share of those who reached it |
|---|---|---|---|
| S1 Country | 1,000 | 40 | 4% |
| S2a and S2b Employment | 960 | 110 | 11% |
| S3 Industry | 850 | 30 | 4% |
| S4 Organization size | 820 | 290 | 35% |
| S5 Department | 530 | 270 | 51% |
| S6 Seniority | 260 | 60 | 23% |
| S8 Technology areas | 200 | 40 | 20% |
| S9 Purchase role | 160 | 80 | 50% |
| S10 Platforms in use | 80 | 10 | 13% |
| Qualified | 70 | Incidence: 7% of starts |
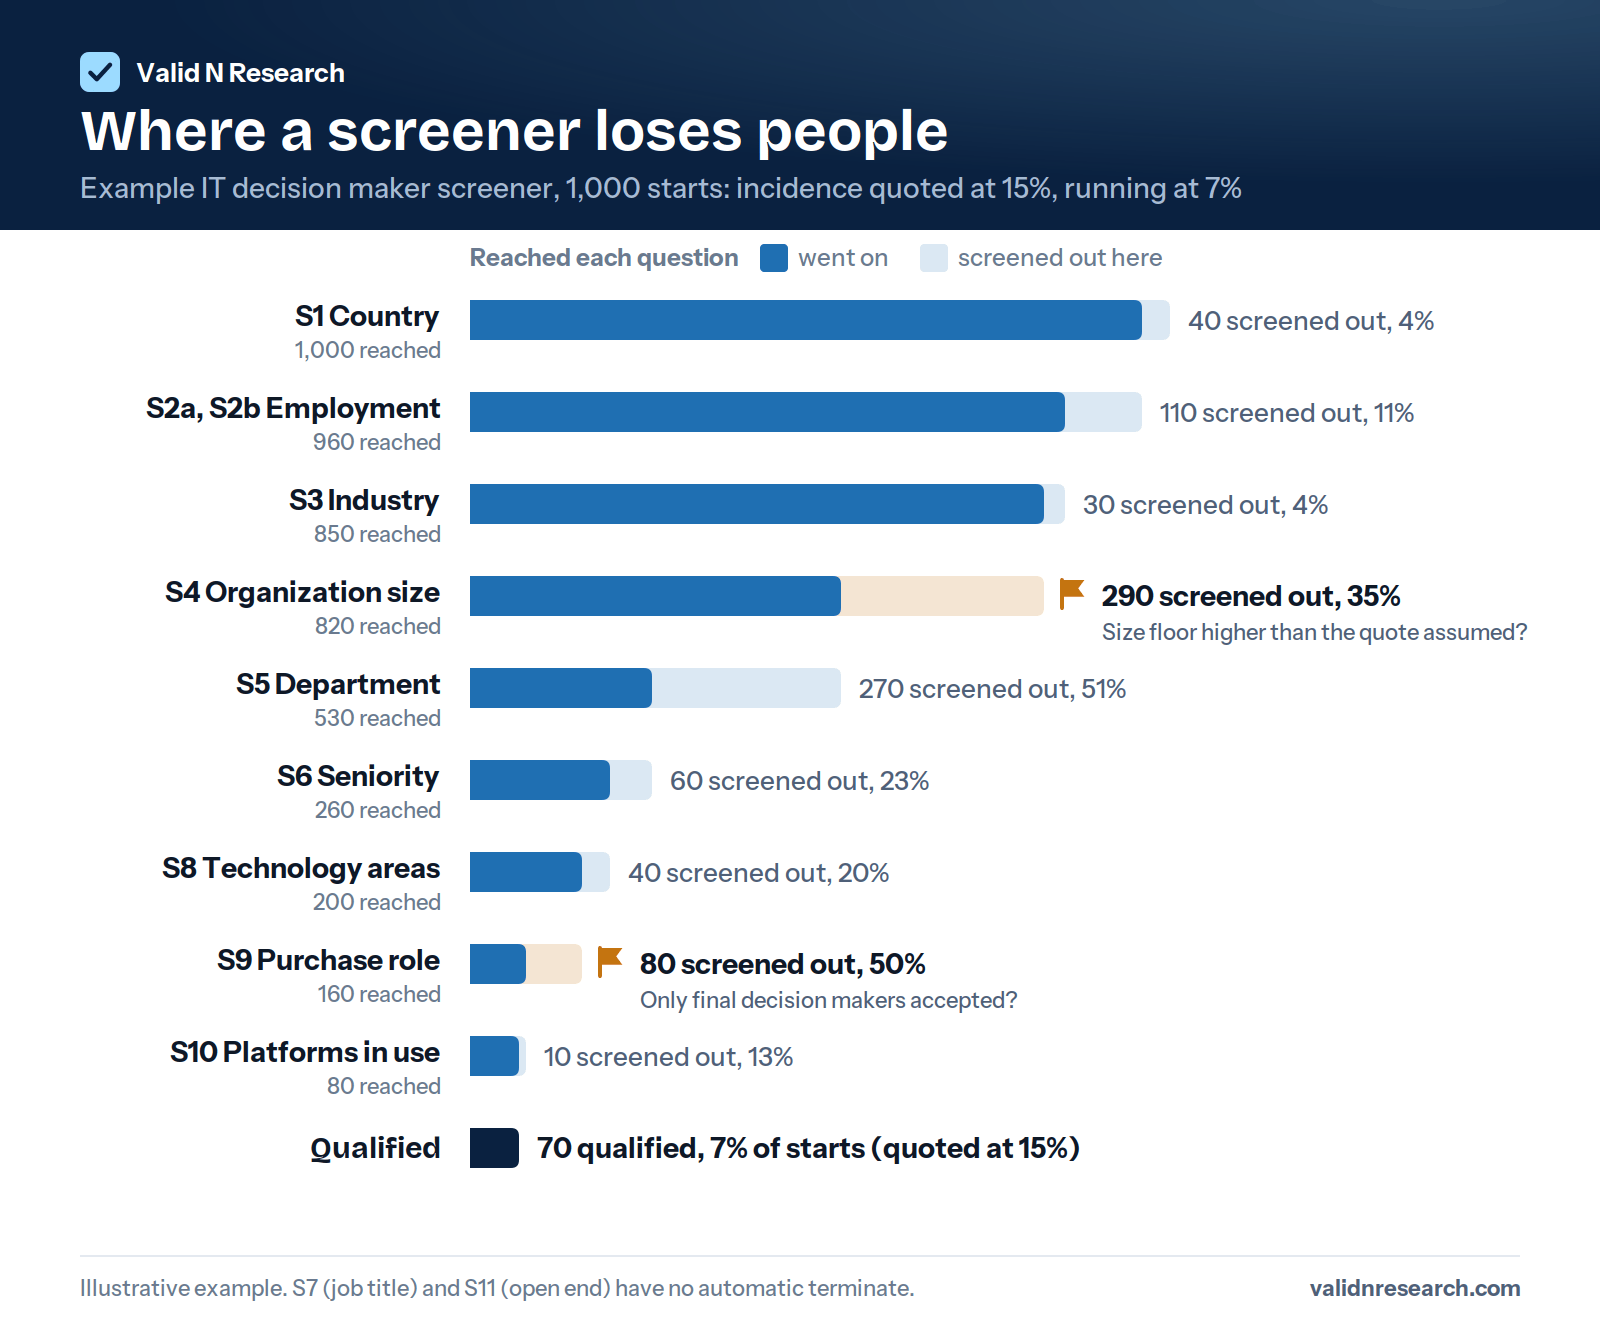
S7, the job title, doesn't terminate anyone, so it isn't in the funnel. Neither is S11, the open end, because a person reviews it during fieldwork. Anyone removed there counts as a quality removal rather than a screen out. In this example, two questions explain most of the gap. Organization size is removing just over a third of everyone who reaches it, which suggests the floor is higher than the quote assumed. Purchase role is removing half, which suggests only final decision makers are being accepted when the quote was based on final and shared decision makers. Department also removes about half, but that's expected when invitations go to general business supply, so it isn't part of the gap. It would point to loose targeting if the supplier said the sample was preselected for IT roles.
2. Take the survey yourself
Go through the live link as a respondent who should qualify. Then go through as one who should terminate at each question. Check that the terminates, skips, and quotas behave as the screener says they should. This takes fifteen minutes and finds errors that no amount of data review will catch.
Check the opposite failure too. A terminate that doesn't fire lets disqualified people into the main survey. Incidence then looks healthy, even high, and the problem only shows up later as completes that have to be removed, or worse, completes that don't get caught.
3. Compare the screener with the brief
Put the brief the quote was built on next to the screener that went live. Any requirement in the screener but not in the brief is a candidate for the gap. This is also the conversation that settles who pays, so it's worth doing carefully.
4. Look at the quota cells
If overall incidence is fine but the study is stalling, the problem is a rare cell rather than the screener. Look at which cells are filling and which aren't.
Your options, from least to most disruptive
| Option | What it does | The trade-off |
|---|---|---|
| Fix a wording or programming error | Restores the incidence the screener was meant to have | None, if caught early. Completes collected before the fix may need a check |
| Extend the field window | Gives the same sources more time | The deadline moves |
| Add sample sources | Increases reach | The source mix changes. On a tracker, that can affect comparability with earlier waves |
| Relax one requirement | Raises incidence directly | Changes who the data represents. Needs the sponsor's agreement, in writing |
| Loosen or merge quota cells | Makes the hardest cells fillable | Fewer cells you can read separately |
| Reduce the total sample size | Cuts cost and time | Wider margins of error |
| Recruit the hardest cell a different way, such as custom recruitment | Reaches people standard sample can't | Slower, more expensive, and mixes methods |
The worst option is the silent one: loosening the screener to hit the number without telling anyone. The study finishes on time, and the data describes a different audience than the one in the report.
Who pays when incidence drops
It depends on what was agreed. Some quotes hold the cost per complete (CPI) for the agreed brief, whatever the actual incidence. Others are based on an estimate, and the price is revised if incidence comes in lower. Both are legitimate. The problem is finding out which one you have after field starts.
Two questions settle it in advance:
- Is the cost per complete held if incidence comes in below the estimate? If not, what is the tolerance, and how is a revised price calculated?
- What counts as a change in the spec? A tighter company size floor or an added quota almost certainly does. A clarified definition may not.
At Valid N, the quoted cost per complete holds for the agreed brief, including when actual incidence comes in below the estimate. If the requirements change, we confirm any pricing change before proceeding.
How to stop it happening on the next study
- Send the actual screener with the feasibility request. A quote is only as accurate as the definition behind it. Our guide to IT decision maker screener questions shows what a complete screener looks like.
- Test incidence first. Run an incidence test on a new or unusual audience before committing to the full study.
- Soft launch. Field the first part of the sample as a soft launch, and review the screener funnel before you spend most of the budget.
- Agree on the incidence definition in writing, including how over quota, screener abandons, drop offs, and removals are counted.
- Build time into the plan for rare cells. The hardest combination sets the timeline, not the average.
If you have a study coming up, send us the brief and the screener, and we'll come back with feasibility and incidence based on the screener you'll actually field.
Related guides
IT decision maker screener questions
A complete example screener with wording, terminate logic, and the knowledge checks that catch fakes.
Read the guideB2B brand tracker shifts
Six checks before you report a wave-to-wave change, and how to keep waves comparable.
Read the guideB2B concept test sample size
What 100, 200, and 300 per cell buy you, and how to design around a small, expensive audience.
Read the guideLow survey incidence: frequently asked questions
Why is my survey incidence so low?
Usually because the screener is stricter than the brief the quote was based on, one question is terminating far more people than expected, or there's a programming error. Check the math first, since over quota respondents and drop offs are often counted as screen outs, then look at which screener question is removing the most people.
How do you calculate incidence rate?
Divide the number of respondents who qualify, including over quota respondents, by the number who start the screener. If 1,000 people start and 150 qualify, incidence is 15%. Quality removals and drop offs are reported separately. Some suppliers leave people who abandon the screener partway out of the starts, so agree the definition before field.
Who pays when survey incidence is lower than quoted?
It depends on what was agreed. Some suppliers hold the cost per complete for the agreed brief, whatever the actual incidence, while others revise the price if incidence falls. Ask before field starts, and agree what counts as a change in the specification.
What is a normal incidence rate for a B2B survey?
There isn't one. It depends on the audience, company size, purchase role, and every other screener requirement. Ask any supplier for their estimate and the exact definition it's based on, because two estimates for "IT decision makers" can describe very different screeners.
Do quality removals count against incidence?
No. A respondent removed for speeding or a bad open end qualified first. Report removals separately, with their own denominator.
How early can I tell if incidence is going to be a problem?
Usually during the soft launch, and often sooner. A few hundred screener starts are enough for the funnel to show which questions are terminating people and whether incidence is near the estimate. You don't need to wait for a tenth of the completes.
Should I relax the screener to hit the target?
Only with the sponsor's explicit agreement, and only after checking for errors. Relaxing a requirement changes who the data represents. If you do it, document when it changed and read the data before and after separately.
What's the difference between incidence and completion rate?
Incidence is the share of screener starts that qualify. Completion rate is the share of qualified starters who finish the survey. Low incidence points to the screener or the audience. A low completion rate points to the survey itself, usually its length or a difficult question.
Send the spec. Get real numbers back.
Audience, market, target n, expected interview length. Feasibility the same business day for standard audiences, with reachable counts, an estimated qualification rate we believe and a quoted cost per complete that stays fixed for the agreed brief.