B2B survey response rates: what to expect and how to raise them
What response rates B2B and executive surveys actually achieve, what the research says raises them, and how to tell whether a low response rate is a problem for your data.
 By Jennifer Ray, founder of Valid N ResearchPublished
Published response rates, earlier and later reviews
Earlier reviewLater review
Surveys of individuals52.7% (2000 and 2005) to 68% (2020)
Surveys of organizations35.7% (2000 and 2005) to about 55% (2020)
Surveys of executives34% (1992 to 2003) to about 33% (2006 to 2023)
Key points
- Definitions"Response rate" means something different for your own list than it does for panel sample. Make sure you've agreed on what it means before you compare numbers.
- BenchmarksPublished academic reviews report averages of roughly 35% to 55% for surveys of organizations and 53% to 68% for surveys of individuals, depending on the period. Academic research often differs from cold commercial outreach, so don't use these as a target for a cold list.
- ExecutivesPublished surveys of executives come in at around a third, and that figure has held largely steady since the mid 2000s.
- What helpsIn research on executives, an invitation from someone they trust consistently stands out. In trials more generally, a topic that matters to the respondent helps.
- LengthShorter surveys get more people to start and complete. Tell them how long it takes, and keep it short.
- Data qualityA low response rate doesn't in itself make the data invalid. It becomes an issue when respondents differ in some systematic way from those who didn't respond. That's nonresponse bias, and it can seriously affect how far your findings can be trusted and generalized.
You sent out the invitations three days ago. Only a small number of people have gotten back to you, and the team is already asking if that's normal or if the study is in trouble.
It all depends on where the sample came from, what you're counting, and who you're trying to reach. This guide looks at what the published research says about B2B and executive response rates, what drives them, and how you can tell whether a low response rate is actually a problem for your data.
How to calculate a survey response rate
Before comparing your number with anyone else's, make sure you're actually counting the same thing. There are three different measures, and they're easily confused:
| Measure | How it's calculated | What it tells you |
|---|---|---|
| Response rate | Completes ÷ eligible people invited | How much of your list took part. Meaningful when you know who is eligible, such as your own customer or member list. |
| Participation rate | Completes ÷ everyone invited | The usual measure for opt-in panel sample, where eligibility often isn't known until people are screened. |
| Survey start rate | Starts ÷ invitations delivered | How many recipients started the survey, whether or not they finished. Often quoted as a response rate, which it isn't. |
The key difference between the first two measures is who counts in the denominator. If you invite 1,000 customers and later find that 800 of them were eligible, a response rate uses 800. A participation rate uses all 1,000.
Two other numbers matter just as much once people start:
- Incidence is the share of screener starts that qualify. If it's lower than expected, it may indicate a mismatch between the audience, the screening criteria, and the incidence assumption. Check those before changing the invitation. See how to troubleshoot incidence that's lower than quoted.
- Completion rate is the share of qualified respondents who start the main survey and complete it: completes divided by main survey starts. A low completion rate points to the survey itself, usually its length or a difficult question.
Buying panel sample
If you're buying panel sample, response rate isn't the most useful measure. The supplier manages recruitment and invitations, and you're paying for completes from the right people within the agreed field window. Watch incidence, drop off, how many completes are removed for quality, and field time.
Surveying your own list
If you're surveying your own list, the response rate is yours to manage, and most of this guide is for you.
Average B2B survey response rates
Among the most widely cited published benchmarks are reviews of academic management research, where studies routinely report their response rates. They're useful, with one important caveat.
| Study | What it covered | Reported finding |
|---|---|---|
| Baruch and Holtom, 2008 | 463 surveys in 17 management journals, published in 2000 and 2005 | 52.7% for surveys of individuals, 35.7% for surveys of organizations |
| Cycyota and Harrison, 2006 | 231 surveys of top managers in nine management journals, 1992 to 2003 | Median 32%, mean 34%, and declining over the period |
| Holtom, Baruch, Aguinis and Ballinger, 2022 | 1,014 surveys in 17 journals, sampled from 2010, 2015 and 2020 | In 2020, 68% overall and also 68% for surveys of individuals, with about 55% for surveys at the organization level |
| Borgholthaus and colleagues, 2026 | 263 surveys of executives in published studies, 2006 to 2023 | Mean about 33%, stable rather than declining |
Surveys of organizations, which usually target senior people, came in lower than surveys of individuals in both reviews that compared the two. Rates also vary widely within the same review. In the 2022 review, two journals that publish many surveys of firms, the Strategic Management Journal and the Journal of International Business Studies, averaged 17% and 21% in 2020.
One caveat: these are academic studies, and academic research can differ from cold commercial outreach. Some are sponsored by a university, a professional association, or an employer. The 2022 review lists the relationship between researcher and participant as one of the factors to consider when interpreting response rates. If you're sending a commercial survey to a list of people who don't know you, don't use these averages as a target. None of these reviews gives a benchmark for cold commercial lists.
Executive survey response rates
Executive surveys can be particularly difficult to field. Cycyota and Harrison reviewed 231 published surveys of top managers from 1992 to 2003 and found a median response rate of 32% and a mean of 34%, with rates declining over the period. A 2026 update by Borgholthaus and colleagues reviewed 263 published surveys of executives from 2006 to 2023 and found a mean of about 33%. It found no evidence of a continued decline over that period.
The update also looked at how the surveys were run. Studies fielded through a professional research agency, or in person, reported higher response rates than studies sent by mail. That's a comparison across published studies, not a controlled test, so other differences between them may explain part of the gap. These are academic benchmarks, not expectations for a cold commercial list.
Is it too early to worry about a low response rate?
Responses usually arrive in bursts, shortly after the invitation and after each reminder, then slow down. A few days in, before any reminder, is usually too early to judge the final rate.
Before you send more, check that the invitations arrived:
Look at bounces and delivery reports. A large share of bounces points to an out of date list.
Test the link from a corporate inbox. Company email security systems can quarantine messages, rewrite links, or open them automatically to scan them. Automated scans can make your start rate look higher than it is, so don't treat opens or clicks alone as proof of engagement.
Check that your sending domain is authenticated. Unauthenticated email is more likely to be filtered before anyone sees it.
If the invitations arrived and response is still very low after the first reminder, look at relevance, length, and who the invitation comes from. Those are covered below.
Does a low response rate mean bad data?
Not automatically. The 2022 review is clear about this: "a low RR does not necessarily mean low quality," and "high response rates do not guarantee validity."
The concern is nonresponse bias: respondents and nonrespondents may differ in ways that affect the findings. A 15% response rate from a group that matches your list may produce more useful findings than a 40% rate where most senior people dropped out, though matching known characteristics can't rule out every difference.
Three checks help:
Check 1Compare respondents with the list on characteristics you already know.
Company size, industry, region, job level. Differences show where bias may be. If enterprise accounts or senior titles are missing, read the results with that in mind, or weight them if you have reliable figures for the list. A close match is reassuring, but it can't rule out differences in the answers themselves.
Check 2Compare early and late responders.
People who answer only after a reminder often serve as a rough proxy for those who never answered. If their answers look similar to the early group's, that's a good sign.
Check 3Look at who finished, not just who started.
A long survey can filter out the busiest respondents, who are often the most senior.
How to increase B2B survey response rates
The evidence below comes from controlled trials that test one change at a time, and from reviews of published studies, which compare surveys that differ in many ways at once. Each finding says which kind it comes from.
- Controlled trialsTest one change at a time, with people assigned at random.
- Reviews of published studiesCompare published surveys that differ in many ways at once.
- Stated intentionsWhat people say they would do, not what they did.
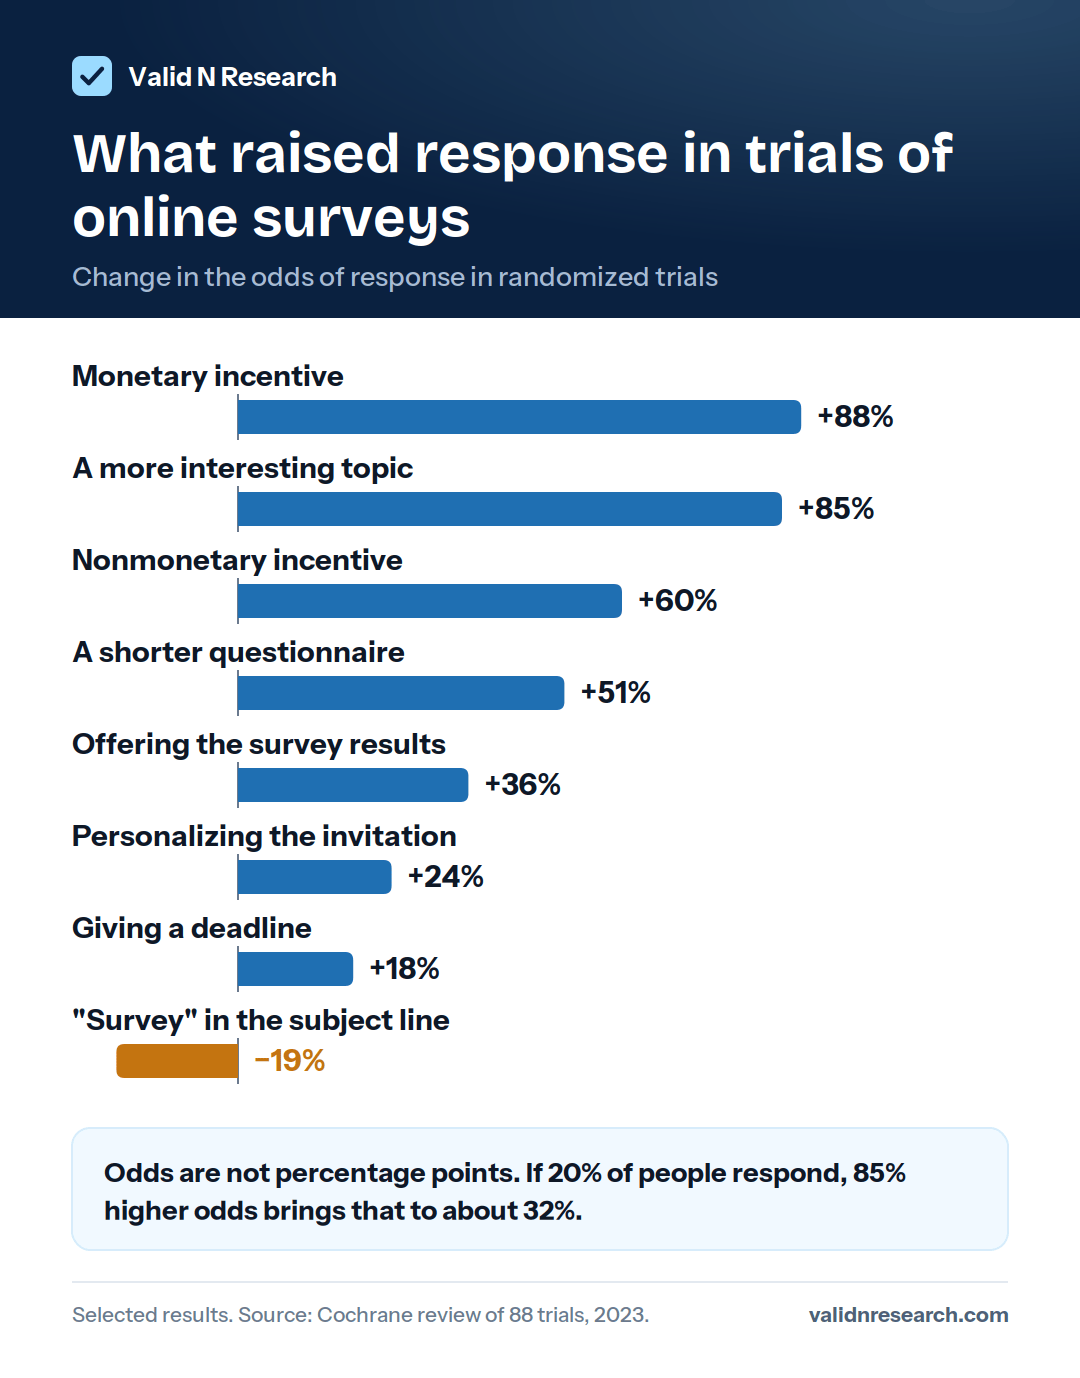
Most of the trial results come from the 2023 Cochrane review of methods to increase response, which included 88 randomized trials of electronic questionnaires. It reports results as changes in the odds of responding. Higher odds aren't the same as that many more percentage points: if 20% of people respond, 85% higher odds would bring that to about 32%, not 105%.
- Controlled trials
- Reviews of published studies
Make the topic matter to the respondent
In the Cochrane review, trials of a more interesting topic raised the odds of response by about 85%. For executives, the evidence is less consistent: Cycyota and Harrison found topic relevance linked to higher response, but the 2026 update found no significant link.
In practiceThe invitation should say in one sentence why the study matters to someone in their role, not just to you.
- Reviews of published studies
Ask through someone they know
This is the most consistent finding for senior audiences. Both executive reviews found that surveys sent through a social network, such as an industry association or a respected peer, were associated with significantly higher response rates. Personalization showed no significant effect in either review, and Cycyota and Harrison found no significant effect of advance notice or follow up contact.
In practiceIf you have a partner, association, or customer advisory group the audience trusts, ask them to send the invitation or endorse it.
- Controlled trials
- Stated intentions
Keep it short, and say how long it takes
In the Cochrane review, a shorter questionnaire raised the odds of response by about 51%, though results varied a lot between trials. Galesic and Bosnjak (2009) told randomly assigned participants that a web survey would take 10, 20, or 30 minutes. The longer the stated length, the fewer people started and finished it. Answers to questions later in the survey were also faster, shorter, and more uniform.
Busy professionals react the same way. In a 2022 study by Seshadri and Broekemier, small business owners and managers rated how likely they were to take surveys of different lengths. Stated willingness fell sharply as length went from 10 to 20 to 30 minutes, and the authors concluded that length had a bigger effect than the type of incentive.
In practiceState the real length in the invitation. If it's 15 minutes, say 15. Our guide to B2B survey length covers how long a survey should be and how to shorten one.
- Controlled trials
- Stated intentions
- Reviews of published studies
Offer something they value
Controlled trials and reviews of published studies don't fully agree on incentives, partly because they measure different things:
- Controlled trialsIn the Cochrane trials, monetary incentives raised the odds of response by about 88%, nonmonetary incentives by about 60%, and offering the survey results by about 36%. The effect of monetary incentives varied widely across trials.
- Stated intentionsIn the small business study, a $20 cash payment, a $20 gift card, and a $20 donation to charity were rated about the same, and all were more appealing than a $600 prize draw. For a 10 minute survey, stated willingness was similar for an offer of the results and for cash. For longer surveys, it was lower for the offer of results. The study measured what people said they would do, not actual response.
- Reviews of published studiesAcross published management studies, the evidence is mixed. Baruch and Holtom's 2008 review found no significant link between incentives and response rates. The 2022 review found higher response rates among studies that reported incentives in 2015 and 2020 (74% against 65% in 2020), but not in 2010. These comparisons were across published studies, not controlled tests, so other differences may explain the results. For executives specifically, Cycyota and Harrison found only one study that mentioned a gift or incentive, too few to test. The 2026 update also didn't test incentives.
In practiceAn incentive is usually worth testing, and the best option depends on your audience, the survey length, and your budget. For short surveys, a summary of the findings may be enough for some senior respondents. For longer surveys, or for interviews, consider a guaranteed payment. Our guide to B2B survey incentives covers the options in detail.
- Controlled trials
- Reviews of published studies
Get the details of the invitation right
The Cochrane review found several smaller changes that also affected response:
| Change | Effect on the odds of response |
|---|---|
| Personalizing the invitation | About 24% higher |
| Giving a deadline | About 18% higher |
| Using the word "survey" in the subject line | About 19% lower |
In practicePersonalization helps in general, but neither executive review found it made a significant difference for executives. Use it, but don't rely on it.
- Controlled trials
- Reviews of published studies
Send a reminder, but don't expect it to rescue the study
Among broader populations, reminders help. In the Cochrane trials of paper questionnaires sent by mail, electronic reminders raised response odds by about 60%, and phone reminders by about 96%. The questionnaires themselves were on paper, so treat the figures as context for email surveys, not a forecast.
For senior audiences, the evidence is more mixed than you might expect. Cycyota and Harrison found no significant effect of follow up contact for executives. Baruch and Holtom found reminders associated with lower response rates in studies of organizations, and the 2026 executive update found the same negative association. The 2022 review found it in 2010, but not in 2015 or 2020. These are comparisons across published studies, so they don't show that reminders reduce response. Researchers are more likely to send reminders when the first wave is already low.
In practiceStart with one reminder a few days after the invitation, with a new subject line and a different opening sentence. If response is still low, review the audience, the invitation, and the survey length before sending another.
How many contacts do you need?
Work backward from the number of completes you need. Suppose you need 300 completes and, as a planning estimate, expect 10% of eligible people invited to complete the survey. You'll need about 3,000 eligible contacts, and 1,200 eligible contacts would give about 120 completes. If instead you have a raw list of 1,200 contacts and only half qualify, expect about 60 completes. To reach 300 completes under those assumptions, you'd need about 6,000 raw contacts. If the study has quotas, work out each group separately, because the hardest quota to fill may determine the total effort.
Estimate it
Estimate the contacts you need
Change the numbers to match your study. The starting values are the example above.
3,000contacts on your list
300 completes ÷ 10% response ÷ 100% eligible = 3,000 contacts
About 120 completes
A planning estimate, not a forecast. Response depends on the audience, the invitation, and the survey length.
If the list is too small, you have three options:
- Option 1Reduce what you need. Check whether a smaller base still answers the question, using the sample size and margin of error calculators.
- Option 2Narrow the scope. Fewer quota cells, or one region instead of three.
- Option 3Add panel sample. The supplier manages recruitment and invitations, though you still need to agree incidence, length, and price before fieldwork begins. The B2B cost per complete benchmarks show what drives the price.
If you're weighing a panel for a B2B study, send us the brief for a feasibility estimate, and we'll come back with expected incidence, price, and a field window.
Request a feasibility estimateSources
The studies this guide draws on. Each title links to the published paper.
- Baruch, Y., and Holtom, B. C. (2008). Survey response rate levels and trends in organizational research. Human Relations, 61(8), 1139-1160.
- Borgholthaus, C. J., Bourgoin, A., Harms, P. D., White, J. V., and Fezzey, T. N. A. (2026). Surveying the upper echelons: An update to Cycyota and Harrison (2006) on top manager response rates and recommendations for the future. Organizational Research Methods, 29(2), 259-280.
- Cycyota, C. S., and Harrison, D. A. (2006). What (not) to expect when surveying executives: A meta-analysis of top manager response rates and techniques over time. Organizational Research Methods, 9(2), 133-160.
- Edwards, P. J., Roberts, I., Clarke, M. J., DiGuiseppi, C., Woolf, B., and Perkins, C. (2023). Methods to increase response to postal and electronic questionnaires. Cochrane Database of Systematic Reviews, Issue 11, MR000008.
- Galesic, M., and Bosnjak, M. (2009). Effects of questionnaire length on participation and indicators of response quality in a web survey. Public Opinion Quarterly, 73(2), 349-360.
- Holtom, B., Baruch, Y., Aguinis, H., and Ballinger, G. A. (2022). Survey response rates: Trends and a validity assessment framework. Human Relations, 75(8), 1560-1584.
- Seshadri, S., and Broekemier, G. M. (2022). Small business executives' online survey response intentions: The effects of incentives and survey length. Small Business Institute Journal, 18(2), 1-9.
Related guides
B2B survey incentives
What works, how much to pay, and who can't accept one, from the research on survey incentives.
Read the guideHow long should a B2B survey be?
Ideal and maximum lengths, what length does to response and data quality, and how to cut a long survey.
Read the guideIncidence lower than quoted?
How to check the math, find the question causing the gap, and the options that protect timeline and budget.
Read the guideB2B survey response rates: frequently asked questions
What is a good response rate for a B2B survey?
There isn't a single number. Published academic reviews report averages of roughly 35% to 55% for surveys of organizations and about a third for surveys of executives. Academic research often differs from cold commercial outreach, so a cold list shouldn't use these as a target. A better question is whether the people who answered look like the people you invited.
What is the average response rate for executive surveys?
A review of 231 published surveys of top managers, from 1992 to 2003, found a median of 32% and a mean of 34%. A 2026 update covering 263 published surveys of executives from 2006 to 2023 found a mean of about 33%, with rates holding steady. Commercial surveys sent to people who don't know the sender shouldn't expect academic rates.
What response rate is too low?
There's no fixed cutoff. A low rate is a problem when the people who answered differ from those who didn't in ways that affect the results. Compare respondents with the list on what you know, and compare early and late responders.
How do you calculate a survey response rate?
Divide the number of completes by the number of eligible people you invited. If 240 of 2,000 eligible customers complete the survey, the response rate is 12%. State how you count partial responses and people whose eligibility you don't know, because different conventions give different rates.
What response rate should I expect from a B2B panel?
With an opt-in panel sample, eligibility often isn't known until people are screened, so a conventional response rate usually isn't available. Suppliers may report participation, start, and completion rates instead. Agree the definitions with your supplier, and track incidence, drop off, quality removals, and field time.
Do incentives increase response rates for B2B surveys?
In controlled trials of electronic surveys, monetary incentives, nonmonetary incentives, and offers of the results all raised response. Reviews of published management studies are mixed, and there's little evidence specific to executives, so test what works with your own audience.
How long should a B2B survey be?
As short as the objective allows. More people start and finish shorter surveys, and answer quality falls later in long ones. Tell respondents the real length in the invitation.
How many reminders should I send?
Start with one, a few days after the invitation. Give people a reason to read it rather than sending the same message again. If response is still low, check delivery, relevance, and length before sending another.
Send the spec. Get real numbers back.
Audience, market, target n, expected interview length. Feasibility the same business day for standard audiences, with reachable counts, an estimated qualification rate we believe and a quoted cost per complete that stays fixed for the agreed brief.